

Accurate labor estimation in commercial roofing is essential for cost control, efficiency and profitability. Traditional estimation methods often rely on experience and historical averages, leading to errors in workforce planning and budgeting. Machine learning is transforming this process by using data-driven approaches to enhance prediction accuracy.
What is machine learning?
Machine learning is a way for computers to learn from data and make predictions. For example, if a model is given past roofing project details such as crew size, roof type and weather conditions, it can learn how these factors affect labor productivity. Later, when given new project details, the model can predict how much labor will be needed.
In simple terms, machine learning helps computers find patterns, make smart guesses and improve over time just like how people learn from experience.
As a roofing estimator and mechanical engineer, I am interested in how technology can help streamline and make projects more efficient. I recently conducted a study that explored how machine learning models can improve labor forecasting by analyzing key factors that influence productivity. By leveraging data from past projects, estimators can make more precise and informed decisions.
Dataset overview
The dataset used in my study consisted of hypothetical historical roofing project data, including key variables that affect labor productivity. These variables include:
- Roof size and type
- Wet ratio (amount of moisture damage)
- Detail ratio (complexity of roof details such as flashings and penetrations)
- Building height
- Time of year
- Crew size
- Management style (self-managed versus traditional supervision)
- Application method (spray versus roll application)
- Roof life expectancy (age and condition of the roof)
The dataset captured linear and nonlinear relationships among these variables and labor productivity. Some factors had straightforward effects; others required advanced modeling techniques to analyze their impact accurately.
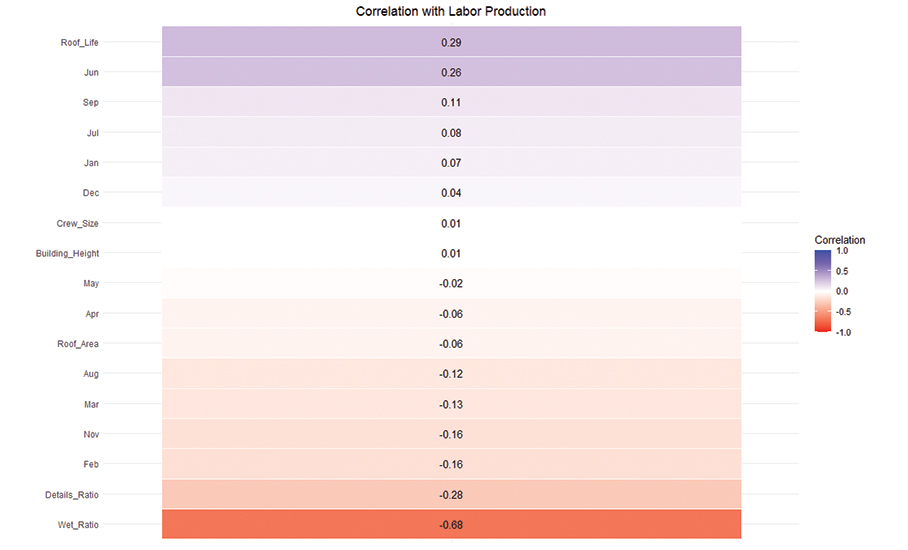
A vertical heat map (see Figure 1) illustrates the correlation between each feature and labor production in roofing projects. Each row represents one variable with color indicating the strength and direction of its correlation to labor productivity. Blue shades represent positive correlations, where an increase in the variable is associated with higher labor production, and red shades indicate negative correlations.
From the heatmap, we see:
- Roof life has the strongest positive correlation (0.29), suggesting longer-lasting roof systems may be linked to better labor performance.
- June, September and July show moderate positive correlations, possibly reflecting seasonal productivity peaks.
- Wet ratio, on the other hand, stands out with a strong negative correlation of -0.68, implying wetter roof conditions significantly reduce labor productivity.
- Details ratio, February, November and March also show negative correlations, suggesting complex detailing and colder months may hinder efficiency.
To analyze labor productivity in roofing projects, I followed a three-step process.
Step one
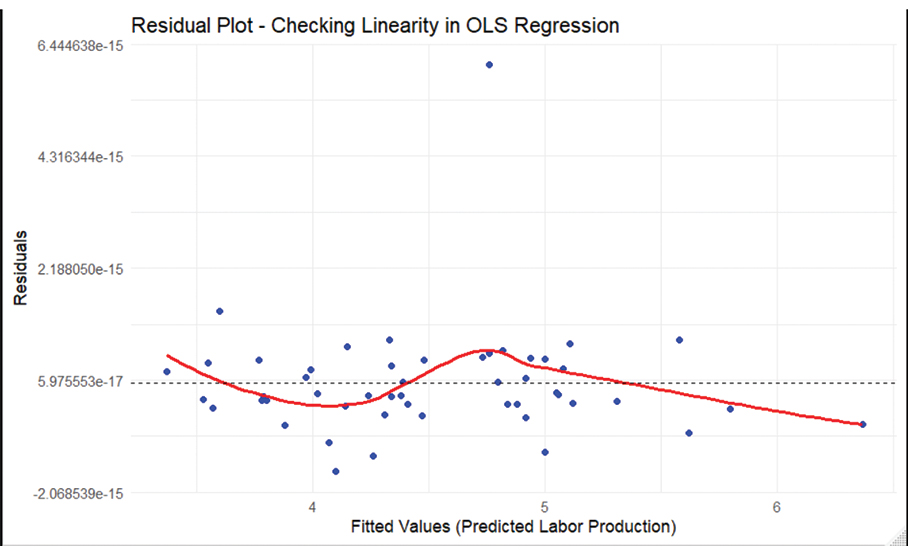
The first step was to see whether the project factors had a simple, straight-line relationship with labor productivity. For example, I wanted to see whether productivity went up by a fixed amount per crew member added. To do this, I used a standard statistical method to build a basic model and then created a chart of its prediction errors known as a residual plot (see Figure 2).
If the simple model were a good fit, the errors would look like a random shotgun blast of dots. Instead, the chart showed a clear, curved pattern. This curve in the errors is a telltale sign the relationship among project factors and labor productivity is more complex than a simple straight line.
This meant a more advanced model was needed to make accurate predictions.
Step two
Step two used a predictive mode. I used insights from step one to capture complex, nonlinear patterns within the data. To account for nonlinear relationships, I selected a random forest model.
A random forest model constructs multiple decision trees and aggregates their predictions, improving accuracy and reducing overfitting. Random forest models illustrate complex interactions between variables, making them well-suited for datasets with nonlinear dependencies. They perform well on structured data with mixed categorical and numerical features.
After training the model, it achieved an 81.44% accuracy rate. An accuracy rate above 80% is generally considered reliable for real-world forecasting applications, making this model a useful tool for estimators.
Step three
The next step focused on analyzing feature importance, highlighting factors that most influence productivity, and providing valuable insights for more effective project planning. Once the model was trained, a feature importance analysis was conducted to determine which variables had the greatest effect on labor productivity.
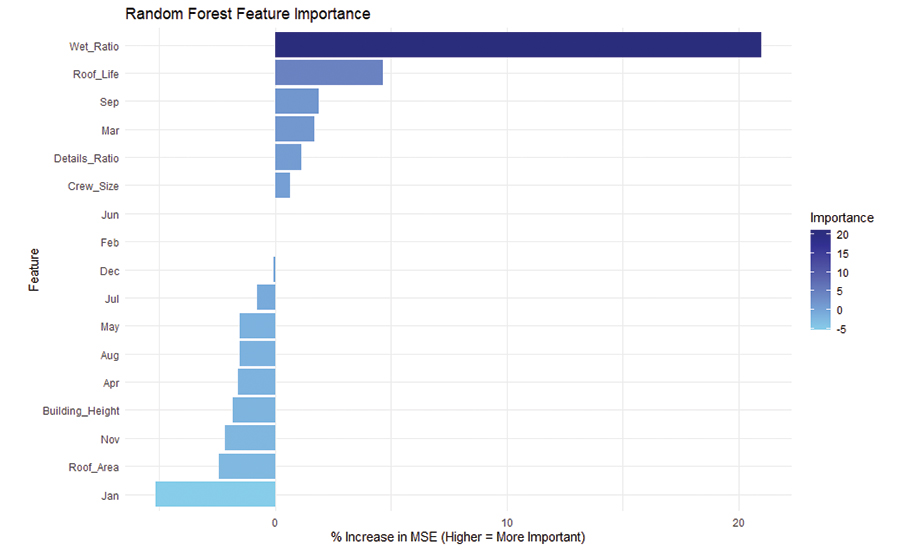
Figure 3 on page 50 displays the feature importance results from a random forest model predicting labor productivity in roofing projects. The metric used here is the percent increase in mean squared error, which shows how much the model’s error increases when a feature is randomly shuffled—higher values indicate greater importance.
In Figure 4, also on page 50, wet ratio stands out as the most critical feature, significantly affecting the model’s predictions. This confirms earlier findings where wet ratio also had a strong negative correlation (−0.68) with labor production.
However, some variables such as September, March and details ratio show moderate importance in this model even though their correlation with labor productivity was weaker. This highlights one of the key benefits of random forest models: They capture nonlinear patterns and interactions that basic correlation cannot detect.
Notably, roof life also is ranked highly, consistent with both correlation analysis and its expected influence on project efficiency. On the other hand, variables like January, roof area and building height show minimal or negative importance, suggesting they do not meaningfully contribute to the predictive power of the model.
This step is crucial because it helps move beyond surface-level relationships and identifies which features truly matter in forecasting labor performance. Although correlation shows only direct, linear relationships, feature importance from a random forest considers linear and nonlinear effects as well as interactions between variables, making it a more reliable tool for decision-making and model development.
Management style
Before analyzing how management style can affect labor production, it’s crucial to recognize this is a nonlinear and highly complex variable influenced by multiple interdependent factors. Key determinants include crew size, organization, skill level and project coordination. With these considerations in mind, the dataset was designed to reflect real-world dynamics:
- Nonlinear relationship between crew size and productivity
- Smaller crews in self-managed teams tend to perform exceptionally well because of efficient task delegation and autonomy.
- However, as crew size increases, productivity declines as a result of coordination challenges and diminishing accountability.
- Effects of project complexity on labor
- Projects with lower wet and detail ratios demonstrate higher labor efficiency in self-management as crews can work with fewer interruptions.
- In contrast, projects with a high wet and detail ratio demand enhanced logistics and organization to enable skilled workers to improve self-management effectively.
- Skill level and its role in self-management
- Highly skilled crews excel in self-managed environments as their expertise allows them to operate with minimal oversight, maximizing efficiency.
- Conversely, less-experienced crews may struggle with self-management, requiring more supervision to maintain production standards.
- The influence of coordination and pre-job planning
- Projects that prioritize kickoff meetings and structured planning sessions tend to benefit self-managed teams the most as these teams rely on clear communication and proactive problem-solving.
- But when projects lack proper organization, conventional management outperforms self-management as direct oversight compensates for planning deficiencies.
Although this approach provides valuable insights, management style is a complex factor that requires further study in different project conditions. Labor production is influenced by many different factors, including team dynamics and job complexity.
Because management style interacts with these factors in different ways, it is important to analyze it across multiple situations to understand its true effect. A single study or dataset may not capture the full range of effects, so continuous evaluation is necessary to identify patterns and trends.
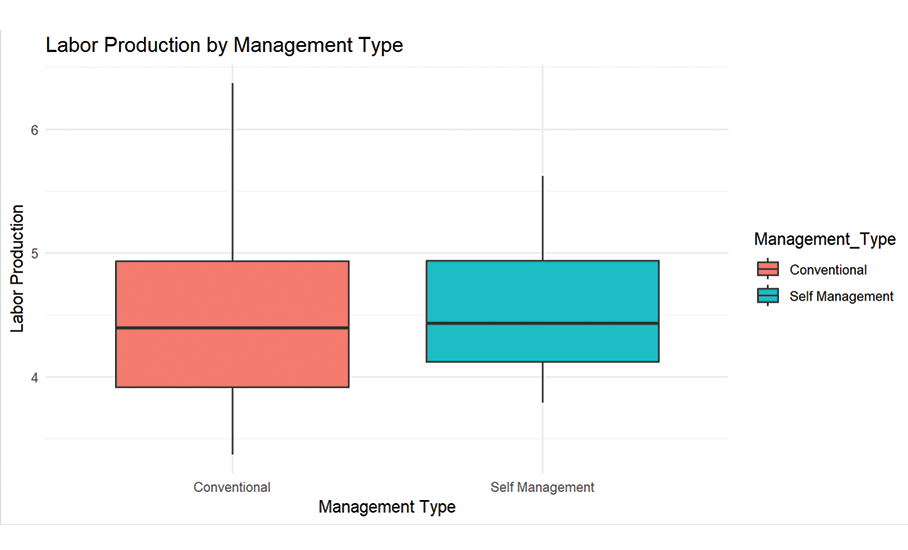
The results in Figure 4 show similar outcomes, suggesting the differences in management style may not be fully captured yet. To gain a clearer understanding, we need to refine the model by training it further and exploring how different variables interact.
Small adjustments in data selection, additional training or incorporating new influencing factors could help reveal stronger distinctions. By deepening this analysis, we can improve our ability to predict labor production under different management styles and develop strategies to optimize workforce efficiency.
Predicting labor production
Like a chatbot, this model can answer specific questions such as predicting outcomes for a new project. By inputting project details, the model can analyze the data and provide estimates based on past patterns. This makes it useful for decision-making, allowing managers and estimators to anticipate labor needs, costs or potential challenges before work begins.
However, for the model to work correctly, the input data must be accurate and relevant as the quality of predictions depends on the quality of the information it processes.
Putting it into practice
Although this study highlights the power of machine learning, the main takeaway for a roofing contractor is not smaller crews working in good weather are more productive but that the data can be leveraged to build a competitive advantage. Following are a few practical steps to begin using machine learning in your business:
Start with data collection. Machine learning runs on data. The most crucial first step is to start digitally recording project information consistently. You can log the information in a simple spreadsheet program; examples include Microsoft Excel or Google Sheets. Go beyond basics like square footage and material costs; track variables such as:
a. Labor. Actual hours per phase (tear-off, insulation, membrane installation, etc.)
b. Conditions. Weather on job days (temperature, precipitation, etc.), moisture damage found (wet ratio) and complexity (details)
c. Team. Crew size, foreman and management style (self-managed or conventional)
d. Timeline. Start and end dates
- Explore AI-powered software. You don’t need to be a coder to use machine learning. Many modern software platforms for the roofing industry are beginning to incorporate these tools. When looking for new software for your company, such as estimating, project management or CRM, inquire about AI, machine learning or predictive analytics features. These tools can help you analyze your historical data to generate more accurate bids, forecast project timelines and identify which types of jobs are more profitable for your company. Examples include specialized estimation software and comprehensive project management suites that offer data dashboard and insights.
- Start small and ask a specific question. Don’t try to predict everything at once. Use the data you collected to answer a single, important business question. For example, are smaller, specialized crews more profitable than larger, general crews for repair work? Answering such a question with your own data can provide an immediate return on investment in your data collection.
Augment, don’t replace
Machine learning is a powerful tool, but it is not a replacement for the intuition and experience of a seasoned estimator. The goal is to combine your professional judgment with data-driven insights. The model might tell you a project should take 400 hours, but your experience will tell you a difficult building owner or tight site logistics will add another 50. The most successful approach uses technology to sharpen, not replace, human expertise.

ARTURO PINA
Roofing estimator
Niles Industrial Coatings LLC